

A candlestick chart documents a given time period of human or algorithmic (e.g. investment robot) behavior, influenced by market-, company- and media news, rumors and assumptions, which affects the stock price.
Being able to use knowledge of previous known structures, like support and resistance levels and understand the influence of mass-human emotional behavior (irrationality, neuroticism and fear), you have a better chance of trying to predict a trend. This is where candlestick patterns can be of big value when trying to time when you should buy or sell.
CANDLESTICK LIFECYCLE
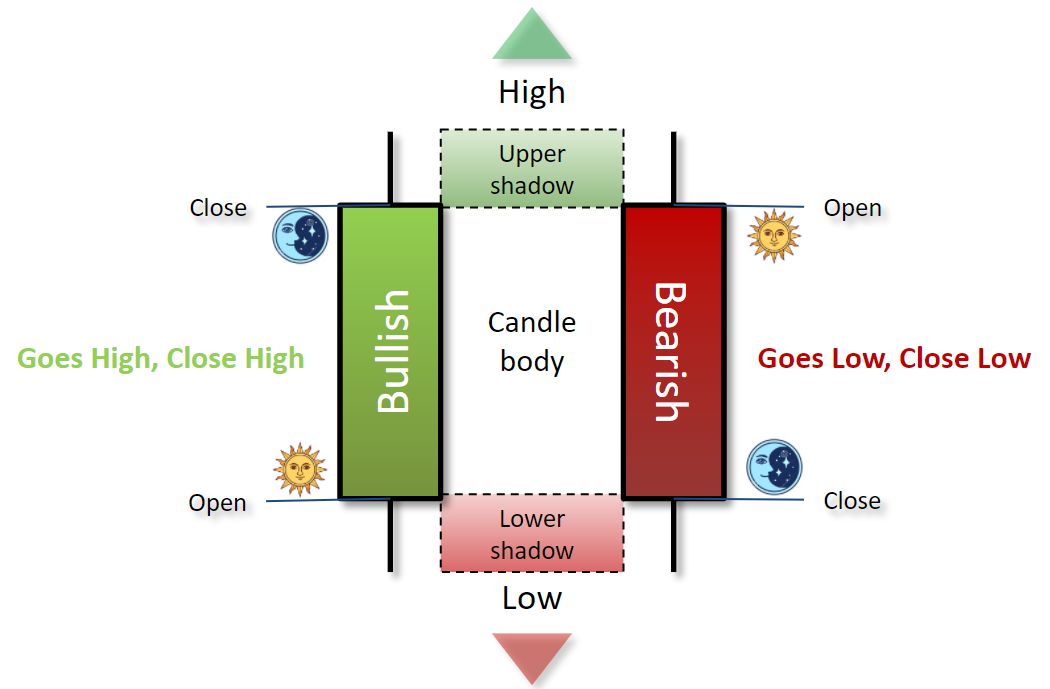
A candlestick represents the price movement for a specific time frame, e.g. a minute, hour, day, month, year, etc. depending on the selected time frame. For simplicity, let's say we're in a day chart and the two candlesticks below represents Day 1 and Day 2.
Note
- A wick (or tail) is the thin vertical line, without a body, at the top or bottom of a single candlestick.
- Bulls means optimistic buyers.
- Bears means pessimistic sellers.
DAY 1 (green candlestick)
- Bears slapped the price to its lowest (bottom wick on green candle).
- Bulls gored the price to its highest (green body + top wick).
- Bears managed to slap the price down a little, before closing (top wick above green body).
- Overall a bullish (green) day.
Day 2 (red candlestick)
- Starts where it closed yesterday.
- Bulls gored the price to the top (top wick on red candle).
- Bears slapped the price way down (bottom wick + red body).
- Bulls resisted and managed to gore the price up a little, before closing (bottom wick below red body).
- Overall a bearish (red) day.
PATTERN INTRODUCTIONS
CANDLESTICK PATTERNS
CHART PATTERNS
HARMONIC PATTERNS
REVERSAL PATTERNS
BEARISH (TOP ROW)
Double Top | Head and Shoulders | Rising Wedge
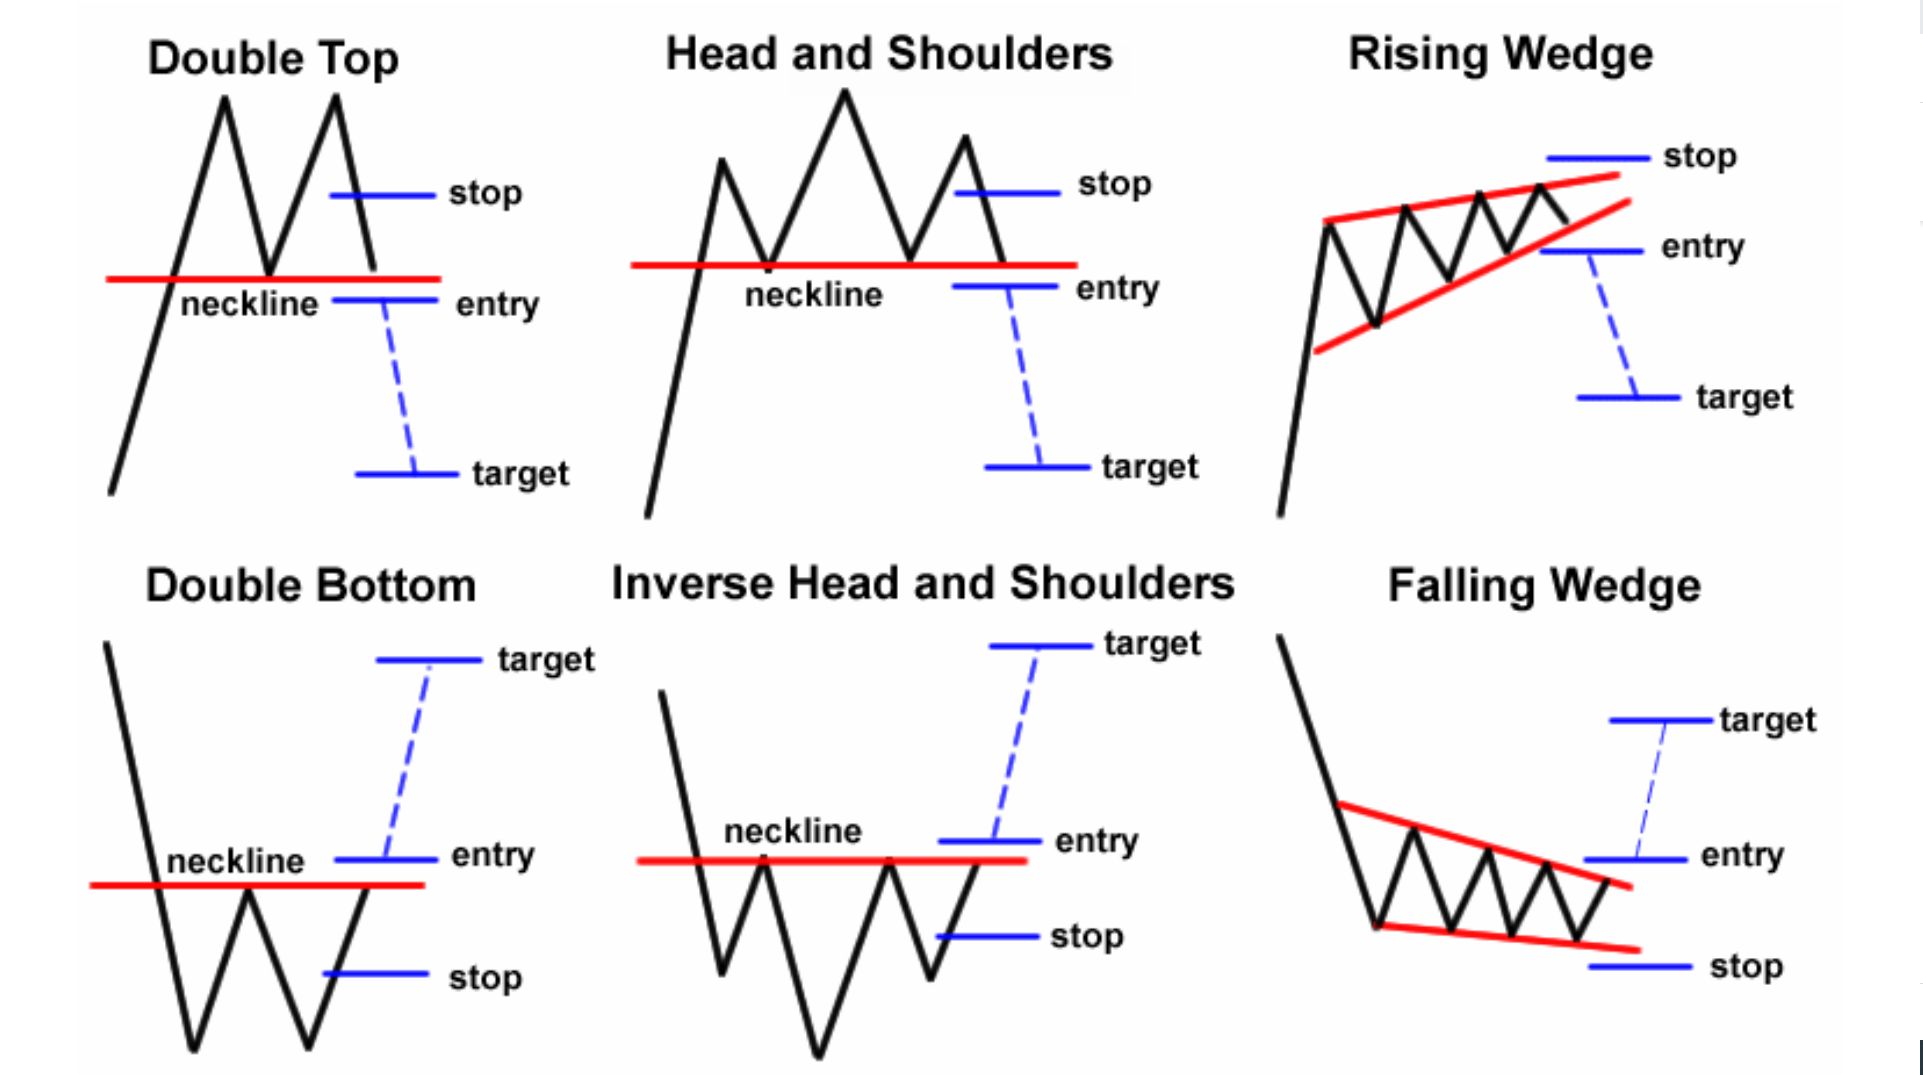
BULLISH (BOTTOM ROW)
Double Bottom | Inverse Head and Shoulders | Falling Wedge
When a price pattern signals a change in trend direction, it is known as a reversal pattern.
CONTINUATION PATTERNS
BULLISH (TOP ROW)
Falling Wedge | Bullish Rectangle | Bullish Pennant

BEARISH (BOTTOM ROW)
Rising Wedge | Bearish Rectangle | Bearish Pennant
Continuation patterns signals that a price trend is likely to remain in play. Even after some volatility the trend will most likely resume.
BILATERAL PATTERNS
NEUTRAL
Ascending- | Decending- | Symmetrical Triangle
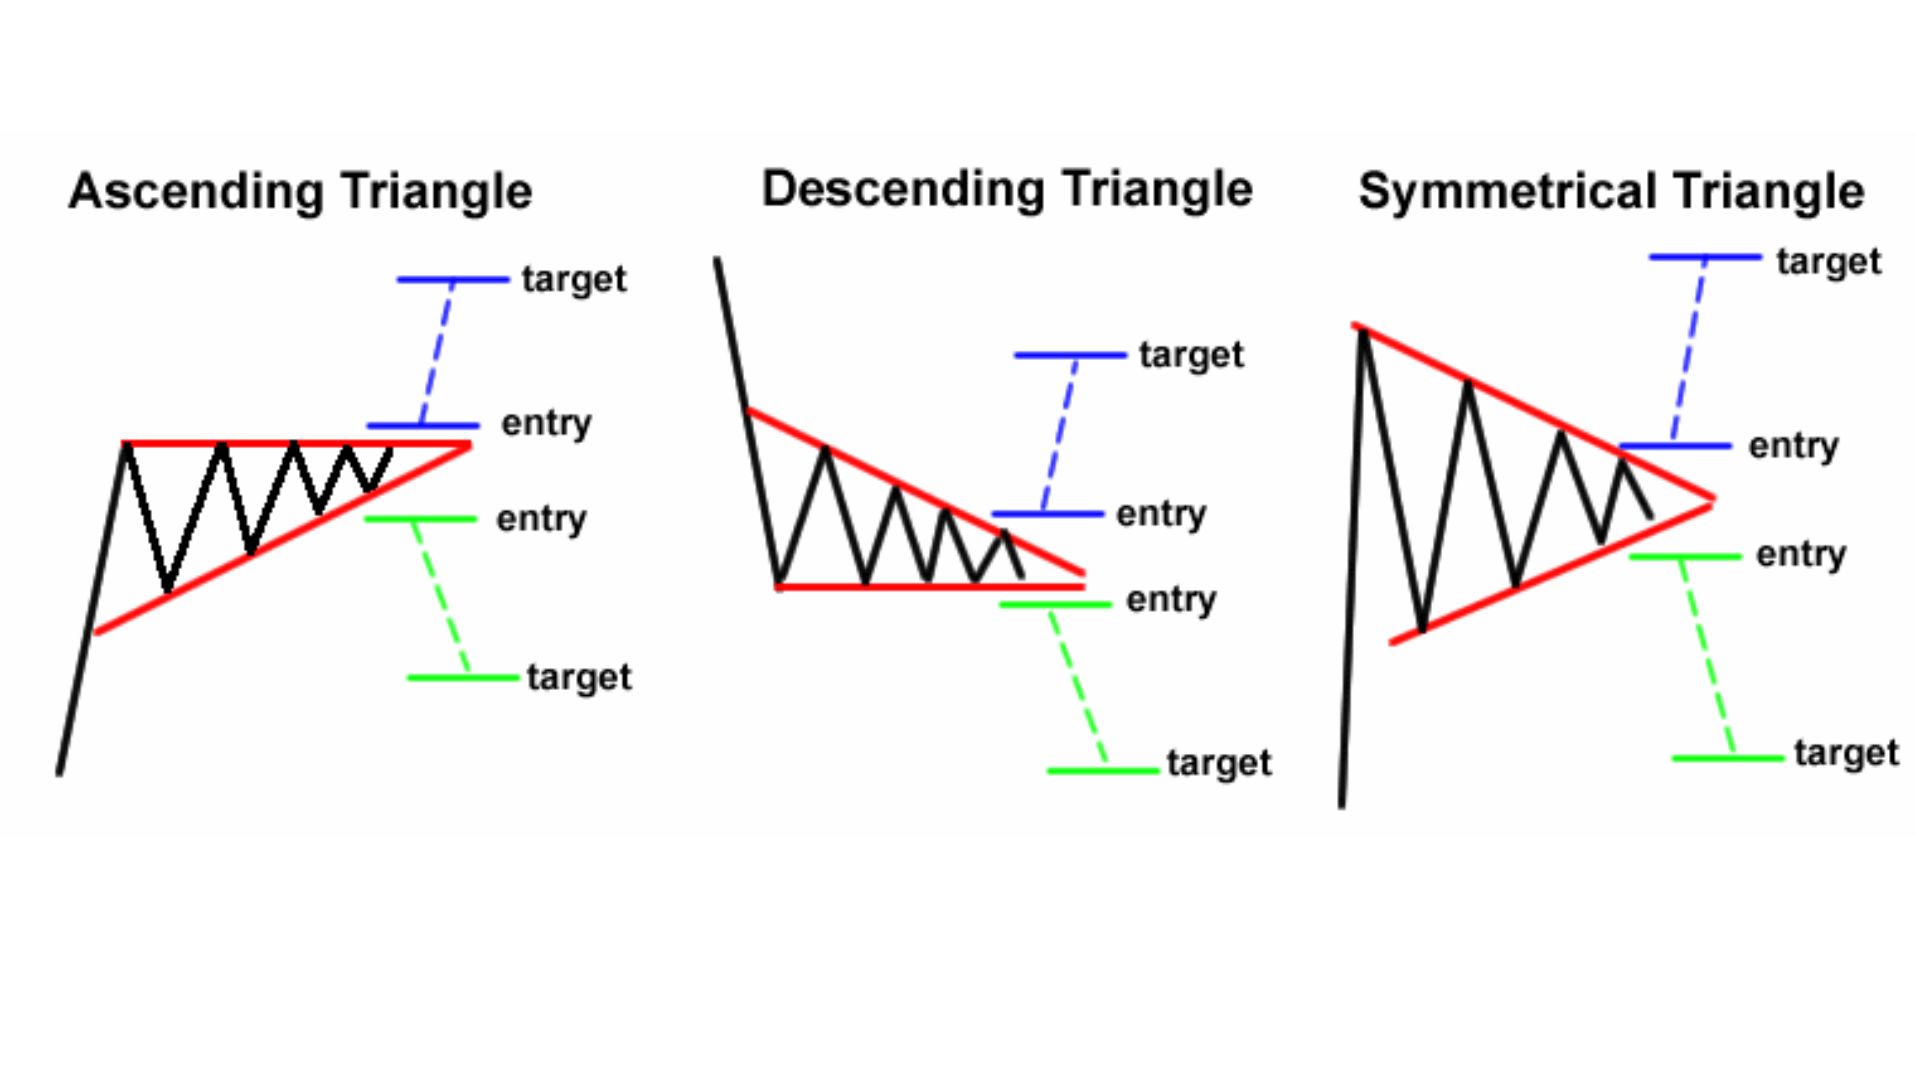
NEUTRAL
It can go both ways
Bilateral patterns are formed in the shape of triangles with the possibility of uptrend and downtrend. Entry to this kind of pattern is very tricky.
INTERACTIVE TRADING WIDGET
You can interact with this trading widget from TradingView, try it out.
TradingView is a leading financial analysis platform and social network used by over 100 million traders and investors globally to track markets, analyze assets, and share trading ideas. Founded in 2011, it provides advanced "Supercharts" for stocks, crypto, forex, futures, and bonds.
Core Platform Features
- Advanced Charting: Access to 15+ chart types, 100+ technical indicators, and 50+ smart drawing tools (e.g., Gann Fans and Elliott Waves).
- Global Market Data: Real-time tracking of over 3.5 million instruments across 100+ global exchanges, including major indices like the S&P 500 and NASDAQ.
- Analysis Tools: Features include Bar Replay for historical backtesting, specialized Stock and Crypto Screeners, and server-side alerts that run even when you are offline.
- Pine Script®: A proprietary scripting language that allows users to create their own custom indicators and strategies.
- Social Network: A massive community where users publish "Ideas," live stream trades, and discuss market trends in real-time.
Awesome. I have learnt
Thank you bro keep doing teaching is for free God will provide more for all of us
God bless you for this rare goodness to humanity. It is rare because most don’t do it. May God prosper you. Commenting from Lagos, Nigeria, West Africa.
Amazing knowledge here am a newbie learning from Nairobi Kenya